RNASeq analysis in 5 lines of code (ARSeq)
September 1, 2019
When it comes to analysing RNASeq data, it can sometimes get quiet intimidating, especially when you are not a computational biologist.
Everyone has their unique way of analysing their data, however, there are a number of basic analysis modalities that most of us in-evidently perform (e.g. Differential Gene Expression analysis, pathway enrichment of the differentially expressed genes, PCA analysis, etc.)
I am here to make that part as easy as possible for you guys so that you can focus on interpreting the results rather than generating them, in hopes it will speed up biological discoveries and advance science in a much faster pace.
Staying true to these words, I present to you
arseq, an automated RNASeq analysis pipeline (R package) that will empower you to perform a plethora of analysis in 5 lines of code.
What can arseq do?
Over all data structure analysis (all samples):
- Euclidean distance between samples
- Poisson distance between samples
- PCA analysis
- PCA Eigenvectors
- Multidimensional scaling (MDS) analysis
- Identify the most variable genes
Analysis between groups of interest:
- Differential gene expression analysis using DESeq2
- Volcano Plot of differentially expressed genes
- Euclidean distance between samples
- Poisson distance between samples
- PCA analysis of the chosen groups
- PCA Eigenvectors
- Multidimensional scaling (MDS) analysis of the chosen groups
- GO enrichment of the differentially expressed genes
- KEGG pathway enrichment of the differentially expressed genes
- KEGG pathway diagrams of the top 5 enriched pathways
- GSEA analysis (H, C1, C2, C3, C4, C5, C6, C7 genesets)
It took me a solid few weekends to write this package and I’m super excited to share it with you guys and learn how many gazillion hours it saves you on your analysis.

Disclaimer: I wrote this package with pure biologists in mind and so it may lack the flexibility that computational biologists will for sure look for. I am planning to maintain the package and so will eventually modularise the package in future versions and subsequently will make it fun and usable for you guys as well.
Let’s get started
Set up R
If you have never worked with R programming, naturally you will need to set that up first. I am not going to show you how to do that here, but if you would like, you can check out one my previous blogs where I briefly explain the process. There are tons of amazing tutorials online as well.

What do you need?
There are two files that you need to start the analysis.
Counts tableMeta datafile
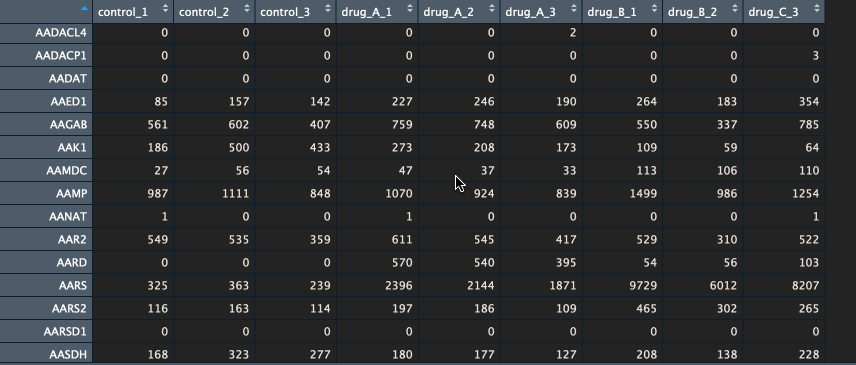
For this task, I am going to assume that you have the counts table ready. Counts table is the un-normalised data where transcripts/genes are in rows and samples in columns. An easy way to figure out if your data is un-normalised counts data is by looking at the counts (numbers). They should be integers (e.g. 1, 5, 23 etc..). If your counts table contains fractional numbers such as (e.g. 0.2, 5.3 etc..), they are probably normalized. Please make sure you are using the un-normalised data as DESeq2 will normalise your data internally.
The package currently supports gene names and ENSEMBL id’s. If you have gene names (HUGO) as identifiers, please make sure that the various transcripts have been summarised into a single unique gene (I recommend summing them). Below is an example of a counts table.
Btw, if you would like to learn how to go from FASTQ files to counts table, let me know in the comments below.
I recommend using some established pipelines like bcbio to generate counts table from FASTQ files. Here is a nice tutorial put together by some of my colleagues to run bcbio on a HPC/server. Note: our HPC at Harvard is called O2 and so please make sure to replace that with your own.
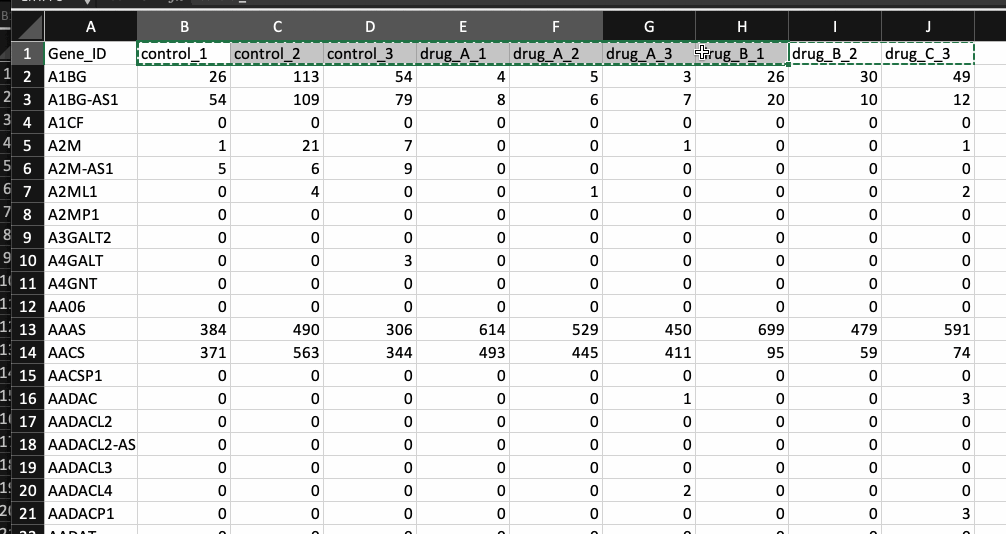
Now, that leaves us with the meta data file. It is nothing but a .csv file with the first column containing your sample names (same as the counts table and in the same order) followed by additional columns containing information about your samples.
Generally the way I prepare my meta data file is by copying the sample names from the counts table and transpose-pasting it to a separate excel sheet. I then continue to add details about the samples. Check the example below.
Awesome! We have all we need to begin the RNASeq analysis.
Begin the analysis
First lets install the arseq package in R. The package requires a minimum R version of 3.4 and so if you haven’t used R in a while, I first suggest updating it to the latest version and then running the following command in your R console to install ‘arseq`.
if( !require(devtools) ) install.packages("devtools")
devtools::install_github( "ajitjohnson/arseq", INSTALL_opts = "--no-multiarch")
The package requires a lot of dependencies and so it is probably going to take a while to install everything. Meanwhile enjoy a nice cup of hot tea ☕️.
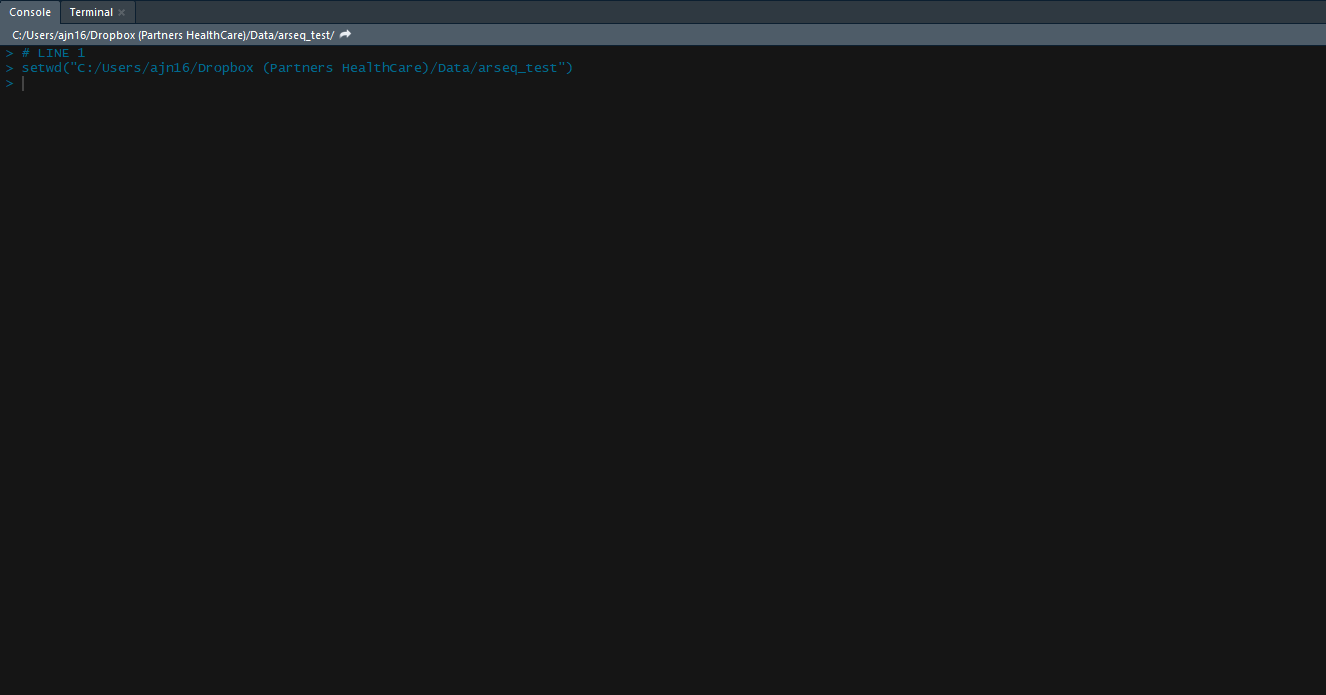
Following installation, we are going to load the package, set the working directory and then load your data into the R environment. Working directory is nothing but the path to the folder which contains your counts table and meta data files. Let’s go ahead and do that with the following 4 lines of code.
## Loading the package to R environment
library("arseq")

## Change the working directory (path to the folder of where your data is located)
setwd("\path to the folder \of where your data is located\")

## Loading counts table into R, remember to change counts_table.csv with your file name
my_data <- read.csv("counts_table.csv", row.names = 1, header = T)

## Loading meta data into R, remember to replace meta_data.csv with your file name
my_meta <- read.csv("meta_data.csv", row.names = 1, header = T)
Common errors at this step could include,
- Your files are not in .csv format. This is fine but then you need to look up online on how to import your specific file format into R. For example, if your file is in
.txtformat, you would useread.tableinstead ofread.csv. An easier alternative is to open your file in excel and save as .csv file. Having said that, please make sure that excel does not convert your gene names into dates. This is a usual bug and I generally find these and remove them manually. If you do not do this, R is going to complain saying that there are duplicates in your file. - The second most common error is to have duplicates in the first column of your data files. In the
counts tablethat would be the gene names and in themeta datafile, it would be the sample names. Please make sure these are unique and not duplicated in any way.
If everything worked, we are good to go. Now lets get ready to run the analysis. There is two more thing you need to know before you can run the analysis.
1. Contrast argument
2. Design argument
We have loaded the counts table and the meta data file, but we haven’t told R what groups to compare for differential gene expression analysis (e.g. control samples or samples that have been treated with a particular drug).
To do that- We would pass this information as an additional argument when we run arseq.
contrast is the argument that serves this purpose. It follows the following format contrast = list(A = c(" "), B= c(" ")). All you need to know however, is to fill in with the names of the groups you are interested in, within the quotations in the above argument.
Let me give you an example:
Say your dataset contains 9 samples-
- 3 samples (control)
- 3 samples (treated with drug-A)
- 3 samples (treated with drug-B)
Now I would like to calculate the differentially expressed genes for two different comparisons (contrasts).
Scenario-1: I would like to identify the genes that have been altered because of drug-A and so I compare the control samples with the samples that have been treated with drug-A. To do so, I use the following contrast argument.
contrast = list(A = c("control"), B= c("drug-A"))
Scenario-2: I would like to identify genes that have been altered between the control samples and samples treated with drug-A & drug-B. To do so, I use the following contrast argument.
contrast = list(A = c("control"), B= c("drug-A", “drug-B”))
It’s that simple.
All you would need to do is to mix and match any number of groups you want within the contrast argument to calculate the differentially expressed genes and the subsequent analysis.
How does R know which samples belong to which group?
We talked about the contrast argument and how to supply groups of interest into it. But how does it know which samples belong to those groups? The contrast argument looks for this information in you meta data file. However, you could have multiple columns in your meta data file describing various things about the samples.
The design argument serves this purpose. It tells R which column of your meta data file should it look into.
Without confusing you too much, the design argument also serves another purpose. If you have ever worked with DESeq, you would quickly realise that it requires a design formula.
The design formula expresses the variables which will be used in modeling. The formula should be variables (column names of your meta data file) with plus signs between them. The design can be changed later, however then all differential analysis steps should be repeated, as the design formula is used to estimate the dispersions and to estimate the log2 fold changes of the model. You can read more about the design formula here, or a quick google search on DESeq2 design formula will bring you a ton of information.
Note: In order to benefit from the default settings of the package, you should put the variable of interest at the end of the formula and make sure the control level is the first level.
At the minimum you should have at least one variable, i.e. the column name of the meta data file that contains your groups of interest.
Okay, now that we know about both the additional arguments (contrast & design), we can run the analysis!
## Run the analysis for scenario-1: Identify the differentially expressed genes between control samples and samples treated with drug-A

arseq (data = my_data, meta = my_meta, design = "treatment", contrast = list(A = c("control"), B= c("drug-A")))

## Run the analysis again for scenario-2: Identify genes that have been altered between the control samples and samples treated with drug-A & drug-B

arseq (data = my_data, meta = my_meta, design = "treatment", contrast = list(A = c("control"), B= c("drug-A", “drug-B”)), qc= FALSE)
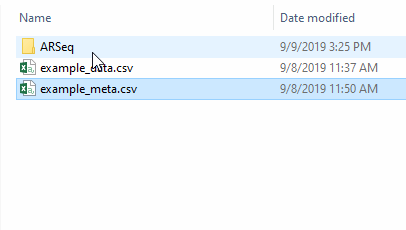
The results will be saved in the same folder as your input data.
If you had noticed closely, in the second run, I included an additional argument called qc = FALSE. This is because when we first ran the analysis, it would have already performed and saved all the general analysis of your data. So during the second run and onwards, you can skip it. This will save you time.
If you do not include this argument, it is not the end of the world. arseq would simply re-compute the general analysis and over write the previous results.
By default, arseq would identify the top 1000 most variable genes, if you would like to change this, you can pass in an additional argument called variable.genes = 500 with the number of variable genes that you would like to compute. In this case, 500.
## In order to change the number of most variable genes that you need
arseq (data = my_data, meta = my_meta, design = "treatment", contrast = list(A = c("control"), B= c("drug-A")), variable.genes = 500)
If you followed these through well done! You have successfully completed your first arseq analysis.

The results
If you now go to the folder where your data was, your will find a new folder named ARSeq, containing all your results.
For each comparison/contrasts that you perform, a new folder will be created within the ARSeq folder. If you perform the same contrast again, the old results will be overwritten.
Example dataset
The package comes with an example dataset. In order to familiarise yourself with the package and its requirements you could play around with the example dataset.
## view the example counts table
head(example_data)

## view the example meta data
head(example_meta)

## Set the working directory. Folder to which you would like to save your results.
setwd("\path to the folder \that you would like to save the results\")

## Run the analysis. Here we are identifying the differences between control samples and treatment1 samples.
arseq (data = example_data, meta = example_meta, design = "treatment", contrast = list(A = c("control"), B= c("treatment1")))
Cite
If you found this package useful, please do cite the github page in your publication. Thank you.
Issues and Features
If there are any issues please report it at https://github.com/ajitjohnson/arseq/issues
Additional information
You can also tweet to me directly for inclusion of new methods into this package.
Hope you successfully analysed your own RNASeq data. If you have an questions or found any particular step difficult to follow, please do let me know in the comments. You might eventually google and figure it out, however, if it took you a while to do so, probably someone else is facing a similar situation as well. So please do let me know and I will update the article to make it more enjoyable for every one.
Bye for now! Have a nice day 😊